

Color vision and web accessibility: practical design beyond color
People do not all perceive color in the same way. A guide from the Japan Ophthalmologists Association gives frequencies of congenital red–green color vision deficiency in Japan of 5% in its male category and 0.2% in its female category. These are Japan-specific figures, not worldwide estimates. This article explains color vision differences and shows how to make web content understandable without relying on color alone.
The Japanese source uses the C, P, D and T labels proposed by Japan’s Color Universal Design Organization (CUDO). Here, we explain those labels alongside the English terms protan, deutan and tritan. They describe differences, not a hierarchy of people’s abilities. Clinical terms are identified as such.
Japanese original published: 2026-05-11
How color vision works: three cone classes
Most people’s retinas contain three classes of cone photoreceptors with different, overlapping spectral sensitivities. The nervous system compares and processes their signals to produce color perception.
- L cones: relatively sensitive to longer wavelengths.
- M cones: relatively sensitive to medium wavelengths.
- S cones: relatively sensitive to shorter wavelengths.
These are not separate red, green and blue detectors. The most common arrangement is called C-type in CUDO’s terminology. In clinical terminology, dichromacy means that two functional cone classes contribute to color vision. Anomalous trichromacy uses three, but with altered spectral sensitivities. These terms describe sensory mechanisms; this design guide is not a diagnostic assessment.
Many protan and deutan differences relate to variation in genes associated with L- and M-cone photopigments on the X chromosome. Chromosome configurations, gene combinations and X-inactivation vary, so a simple XX/XY binary does not describe every person. The male/female percentages below retain the categories used by the Japanese source; they do not classify an individual’s gender identity.
Protan, deutan and tritan: what the labels mean
These are three important groups of color vision differences, not an exhaustive classification of human vision. Protan and deutan groups include both dichromacy and forms of trichromacy with different cone sensitivities.
Scroll horizontally if the table does not fit.
| CUDO label | English term | Related cone class | Possible difficulty |
|---|---|---|---|
| P-type | Protan | L | Some reds can appear darker; some red–green combinations can be difficult to distinguish. |
| D-type | Deutan | M | Some red–green combinations can be difficult to distinguish. |
| T-type | Tritan | S | Some blue–green or yellow–pink combinations can be difficult to distinguish. |
Other, rare forms include monochromacy, associated with CUDO’s A-type label. A group name alone does not tell you exactly what someone sees or which everyday tasks they find difficult.
CUDO advocates neutral labels for public communication. Japanese ophthalmology still uses clinical diagnostic terminology, and terminology revisions in the 2000s replaced older Japanese names. The clinical distinctions and CUDO’s public-facing labels serve different purposes. The original Japanese source titles remain unchanged in the references.
Simulated hue bands: useful approximations, not someone’s experience
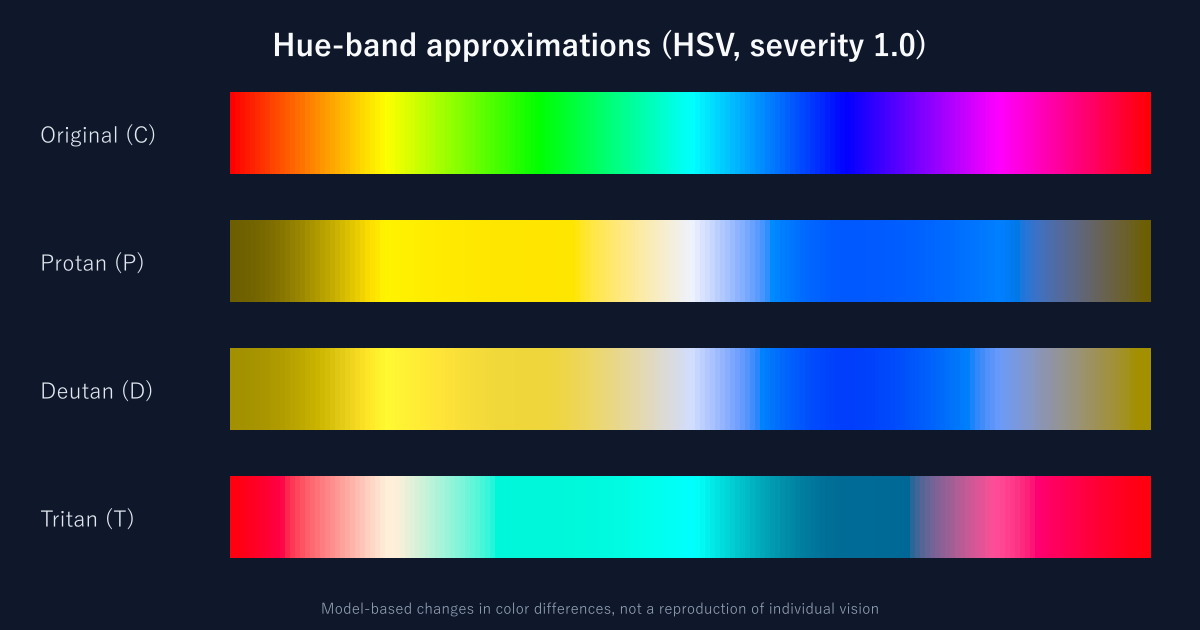
This figure applies the severity 1.0 matrices from Machado, Oliveira and Fernandes (2009) in linear RGB. The value 1.0 selects the model’s dichromacy endpoint; it is not a rating of an individual’s ability or everyday difficulty. The original band follows HSV hue on a display; it is not a wavelength spectrum. The transformed rows illustrate possible reductions in color differences, not an individual’s actual visual experience.
Figure method: Machado, Oliveira and Fernandes (2009), severity 1.0. The original paper title and DOI are in the references.
Protan and deutan differences
Some red–green, brown–green or blue–purple combinations can become harder to distinguish. Some reds can appear darker with protan vision. The particular colors, lighting, area, saturation, lightness and degree of the difference all matter.
Tritan differences
Possible difficulties include blue–green combinations and combinations of yellow with some pale colors. The combinations involved differ from those associated with protan and deutan vision.
Use simulation to find possible design problems. People within the same group can have different experiences. Never present a filtered screenshot as an exact reproduction of another person’s sight.
Reading Japan’s prevalence figures in context
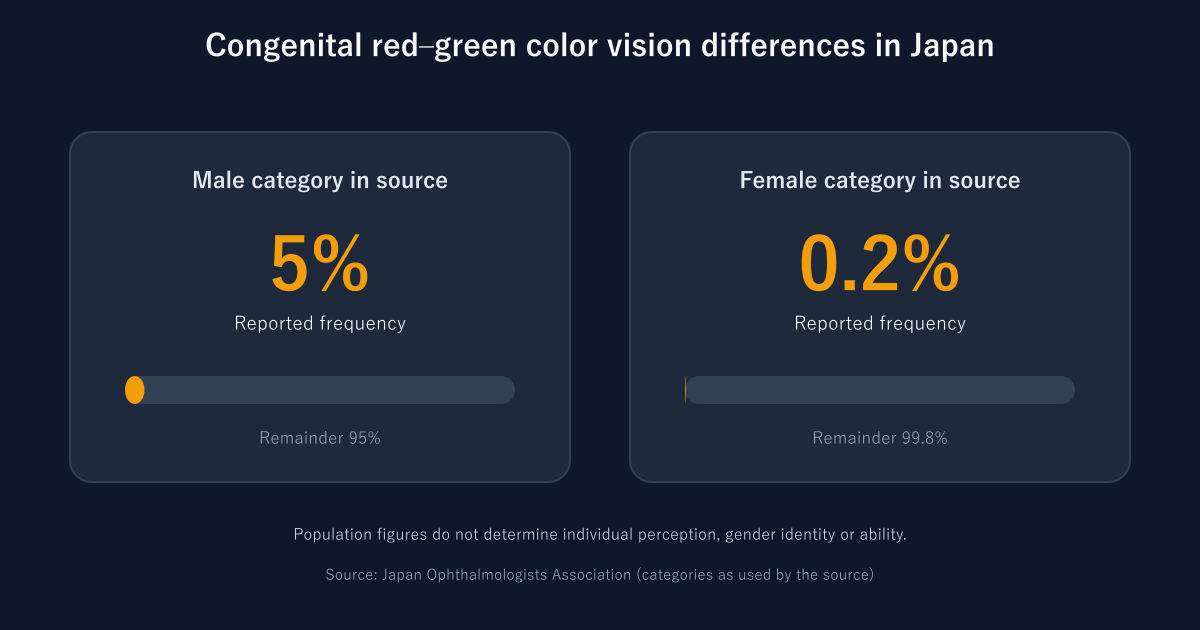
The Japan Ophthalmologists Association’s guide reports:
- Male category in the source: 5%, or 1 in 20.
- Female category in the source: 0.2%, or 1 in 500.
These describe population frequencies. They do not determine a person’s perception, gender identity or abilities. Frequencies can vary with region, ancestry and study methods. Do not apply these Japanese figures to all countries or try to infer a visitor’s needs from their identity. Provide non-color cues by design.
Figure source: Japan Ophthalmologists Association, 色覚異常を正しく理解するために. The category names reflect the source’s classification.
Where color-only web interfaces fail
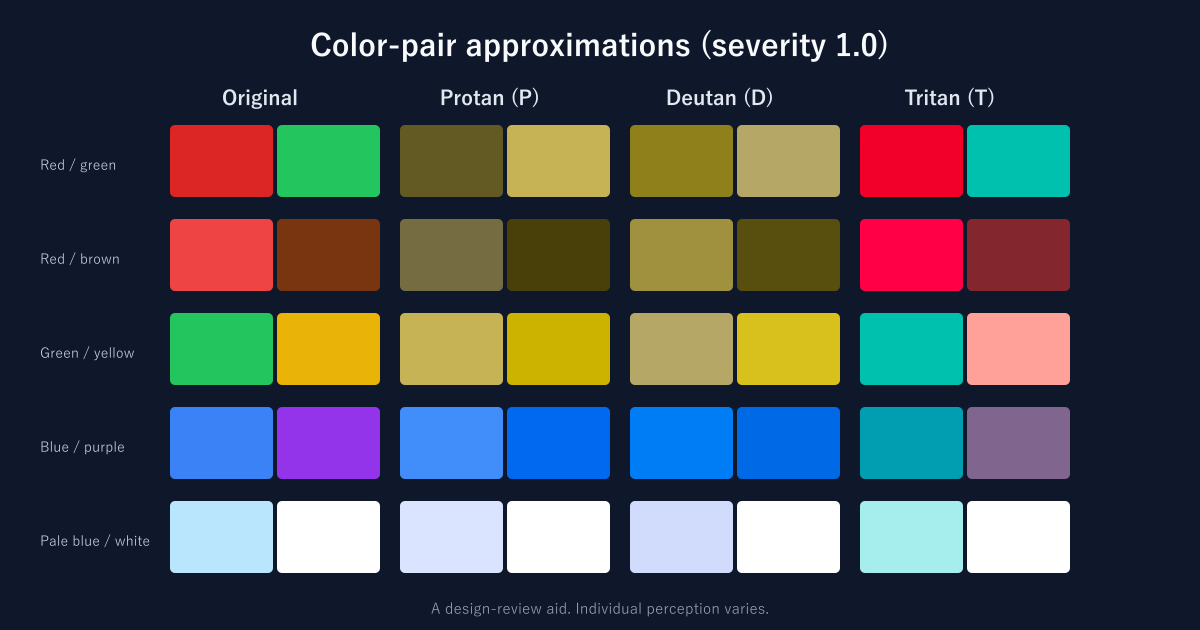
Figure method: Machado, Oliveira and Fernandes (2009), severity 1.0, linear RGB. These are model outputs, not reproductions of individual experience.
Red and green status indicators
Green for success and red for error are familiar conventions. But the distinction can become difficult to see in some conditions. An alert that uses color alone may fail to communicate its meaning.
Chart legends
If color is the only way to match a line or bar to its legend, some readers may be unable to identify the series.
Form validation
A red border alone is an unreliable way to identify an error. A pale border can also lack contrast against the background, regardless of color vision.
Heat maps
Some steps in a red–yellow–green scale can be difficult to distinguish. Add lightness differences, values or patterns, and provide a usable textual or tabular alternative where needed.
Other color pairs
Red–brown and green–yellow can also be difficult combinations, depending on the actual values and viewing conditions. Do not infer a person’s perception from a color name or a group label. Add text or shape cues to navigation and categories.
Relevant WCAG 2.2 criteria
WCAG 2.2 includes several relevant success criteria. The table is a starting point, not a complete accessibility audit.
Scroll horizontally if the table does not fit.
| Criterion | Level | Requirement in brief |
|---|---|---|
| 1.4.1 Use of Color | A | Do not use color as the only visual way to communicate information or distinguish something meaningful. |
| 1.4.3 Contrast (Minimum) | AA | Text against its background: at least 4.5:1 for ordinary text, or 3:1 for large text, with exceptions. |
| 1.4.11 Non-text Contrast | AA | Visual information needed to identify controls and states, or understand graphics: at least 3:1 against adjacent colors, with exceptions. |
Large text generally means at least 18 pt (24 CSS px), or bold text of at least 14 pt (about 18.67 CSS px). Criterion 1.4.3 includes exceptions for logotypes and incidental text. Criterion 1.4.11 excludes, for example, inactive controls and unmodified user-agent appearances. Read the full criteria when determining applicability.
Use of Color does not prohibit color. It prevents color from carrying meaning without another visual means of understanding it. Passing a contrast calculation alone does not establish that a design meets this requirement.
Japanese context: JIS X 8341-3:2016 is based on WCAG 2.0, not WCAG 2.2. For example, 1.4.11 was not part of WCAG 2.0. Meeting the few criteria covered here does not justify a claim of site-wide conformance.
Practical design: add cues beyond color
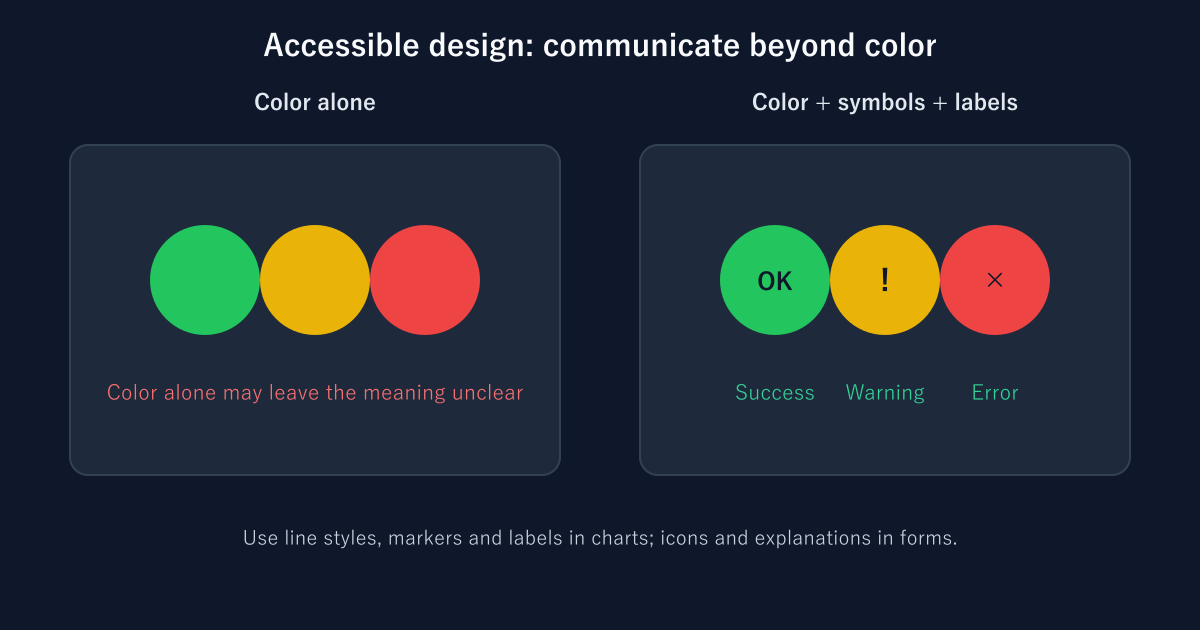
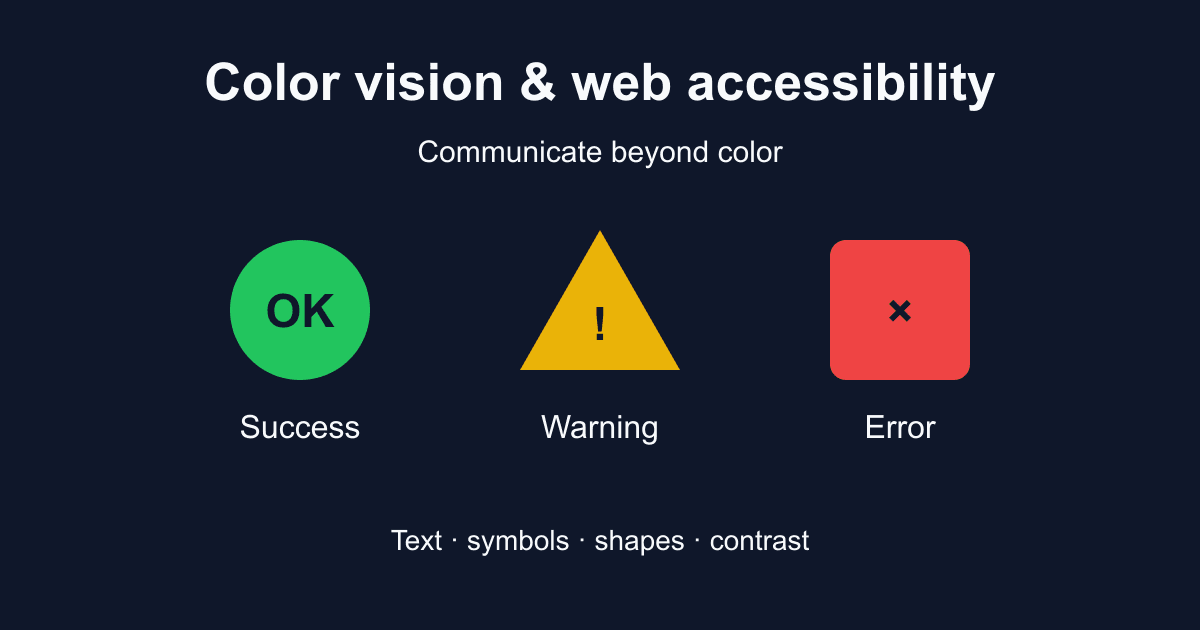
Combine color with another cue, such as a label, symbol, pattern or shape. This improves the information available to readers, but text legibility and programmatic meaning for assistive technology still need separate checks.
Status indicators
- Success: a green background, a distinct symbol and a “Success” label.
- Warning: a yellow background, a warning symbol and a “Warning” label.
- Error: a red background, an error symbol and an “Error” label.
Charts
Use solid, dashed and dotted lines or different marker shapes, and include text labels in the legend. Make sure the non-color cue appears in both the chart and its legend.
Form validation
Pair the border or icon with a text explanation, such as “Enter an email address in the format name@example.com.”
Inline links
A persistent underline provides a non-color cue. In W3C technique G183, the 3:1 ratio compares link text with surrounding non-link text. Text-to-background contrast is a separate requirement; an underline does not remove it. Also make the link’s location apparent on hover and keyboard focus.
Control states
Provide a visible keyboard-focus indicator, such as an outline. Do not rely on a small enlargement alone. Check contrast against the surroundings and whether other content obscures the indicator. Use text or shapes to communicate states such as selected and unselected.
Evaluate actual color values, not “safe” color names
Color Universal Design (CUD) considers diverse ways of seeing when presenting information. The following colors are examples for evaluating a palette, not a certified combination. No hex code alone guarantees readability or distinguishability: background, area, text size, lightness and display conditions matter.
Scroll horizontally if the table does not fit.
| Color example | Hex | Approximate ratio against white |
|---|---|---|
| Orange-red | #FF4B00 | 3.36:1 — below 4.5:1 for ordinary text. |
| Blue-green | #03AF7A | 2.83:1 — below 3:1. |
| Blue | #005AFF | 5.38:1 — above 4.5:1. |
| Orange | #F6AA00 | 1.97:1 — below 3:1. |
Ratios here are rounded for display. Determine whether a threshold is met using the unrounded value. These numbers compare each color with white; they do not compare the colors with one another.
Combinations that need care
Red–green, red–brown, green–yellow and blue–purple can be difficult when hue carries the entire distinction. Blue–orange, blue–red or purple–yellow may offer useful alternatives, but only when the actual colors have suitable lightness differences and additional cues.
Grayscale is not a complete test. Lightness differences can help, but a readable grayscale image does not prove accessibility for all forms of color vision. Retain labels, patterns, shapes and line styles.
A WCAG contrast checker can help evaluate the actual foreground/background pair. It cannot establish a whole page’s accessibility.
Use simulation as one part of a review
Browser simulation helps find potential problems with color choices. It does not establish what every visitor experiences.
Chrome DevTools
Open the page, then the Rendering panel and Emulate vision deficiencies. Modes include Protanopia, Deuteranopia, Tritanopia and Achromatopsia. The first three model dichromatic conditions; they do not cover every protan, deutan or tritan experience.
Firefox
Use the simulation options in the Accessibility Inspector where available. Check the version and platform you are using: names and availability can change.
macOS
Accessibility settings under Display → Color Filters can adjust the screen for a user. These filters are display accommodations, not a faithful simulation of someone else’s vision.
Figma and other design tools
Plugins can offer approximate previews. Before using one, review its permissions, maintenance and data-handling behavior.
Do not finish with simulation alone. Implement non-color cues, and where possible test important screens with people who have different color vision characteristics.
Using NanToo’s Japanese tools
The Japanese WCAG checker calculates contrast; the palette generator produces candidate palettes using HSL color relationships; the color converter converts color values. These tools currently have Japanese interfaces. Palette generation does not guarantee CUD or WCAG conformance. Check the real background and non-color cues separately.
A repeatable review checklist
Accessible design makes meaning easier to recover from more than one cue. Color, symbols and labels can help readers with different color vision characteristics, and can also be useful under glare or other difficult viewing conditions.
- Open the actual page and use DevTools simulation to look for possible problems.
- Check whether status messages and form errors remain understandable without hue differences.
- Check chart labels, marker shapes, patterns and line styles.
- Calculate contrast for the foreground/background pairs you actually use.
- Verify keyboard-focus visibility, text readability and the meaning available to assistive technology.
- Include users with different needs in testing where possible.
Do not fit every visitor into a single model of vision. Communicate the same information through multiple clear, usable cues.
References and sources
- www.nichigan.or.jp: 先天色覚異常|日本眼科学会による病気の解説 ↗
- www.gankaikai.or.jp: 冊子「色覚異常を正しく理解するために」 | 色覚関連情報 | 公益社団法人 日本眼科医会 ↗
- jams.med.or.jp: 日本医学会 医学用語辞典 WEB版:整理された用語<色覚関連用語について> ↗
- cudo.jp: 色覚の呼称 – NPO法人 カラーユニバーサルデザイン機構 CUDO ↗
- W3C: Understanding Success Criterion 1.4.1: Use of Color ↗
- IEEE Transactions on Visualization and Computer Graphics: A Physiologically-based Model for Simulation of Color Vision Deficiency ↗
- W3C: Web Content Accessibility Guidelines (WCAG) 2.2 ↗
- W3C: Understanding Success Criterion 1.4.3: Contrast (Minimum) ↗
- W3C: Understanding Success Criterion 1.4.11: Non-text Contrast ↗
- W3C: G183: Using a contrast ratio of at least 3:1 to distinguish inline text links from surrounding text ↗
- Chrome for Developers: Apply other effects: enable automatic dark theme, emulate focus, and more ↗
- Firefox Source Docs: Color vision simulation ↗
- ウェブアクセシビリティ基盤委員会(WAIC): JIS X 8341-3:2016 解説 ↗
- National Eye Institute: Types of Color Vision Deficiency ↗
- W3C: CSS Color Module Level 4 ↗
- colorspace: Changelog ↗
Editorial note
This article was prepared with AI assistance and reviewed by an editor before publication. It may still contain factual errors, interpretation mistakes, or outdated information. Check the cited primary sources or official documentation before making an important decision.